
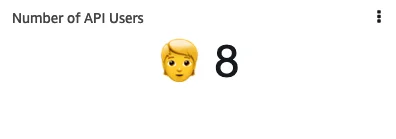
.Dashboard widget for unique users accessing your API
So, you're providing an API to several users. Maybe your API can be used by all employees, or it is public, and anybody can sign up for usage. No matter which case it is, you would probably like to know how many of your users regularly use the API.
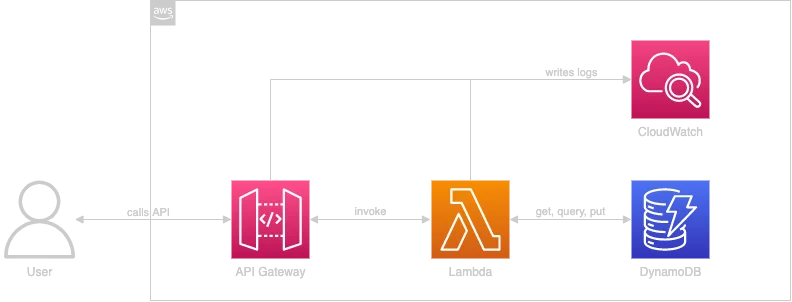
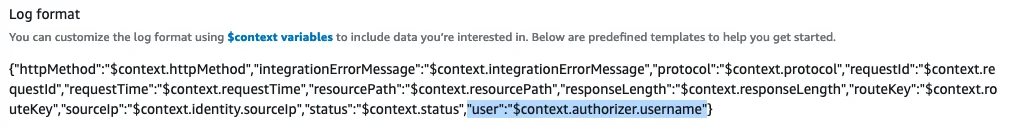
Let's assume, for a moment, that your API is built with AWS API Gateway, calling one or many Lambda functions in the background and DynamoDB as your data storage. As with most AWS services, logs from the API Gateway and Lambda functions get stored in CloudWatch Logs. You even configured API Gateway to provide structured logs and to log the user's ID.
Now, how would you get the number of individual users who have used the API in a given period? You might think about using CloudWatch Logs Insights:
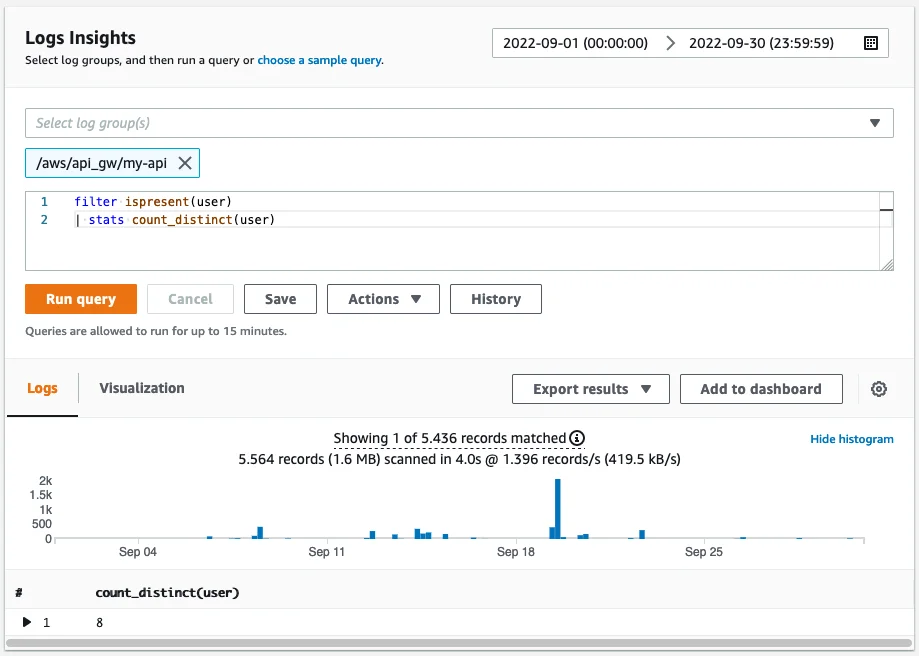
You can add insights to a CloudWatch dashboard as logs table, pie, bar, line, or stacked area chart. While this may work perfectly well for your use case, it may not be good enough for others. According to the documentation count_distinct will only return an approximation if the field has "very high cardinality". Unfortunately, the documentation does not mention what it considers as "very high cardinality".
We're here to get a precise number. As I have recently been in this situation, I stumbled across custom CloudWatch dashboard widgets. In the following section, we will dive into how to create a custom CloudWatch dashboard widget that shows the number of API users for a given period.
Custom Dashboard Widget
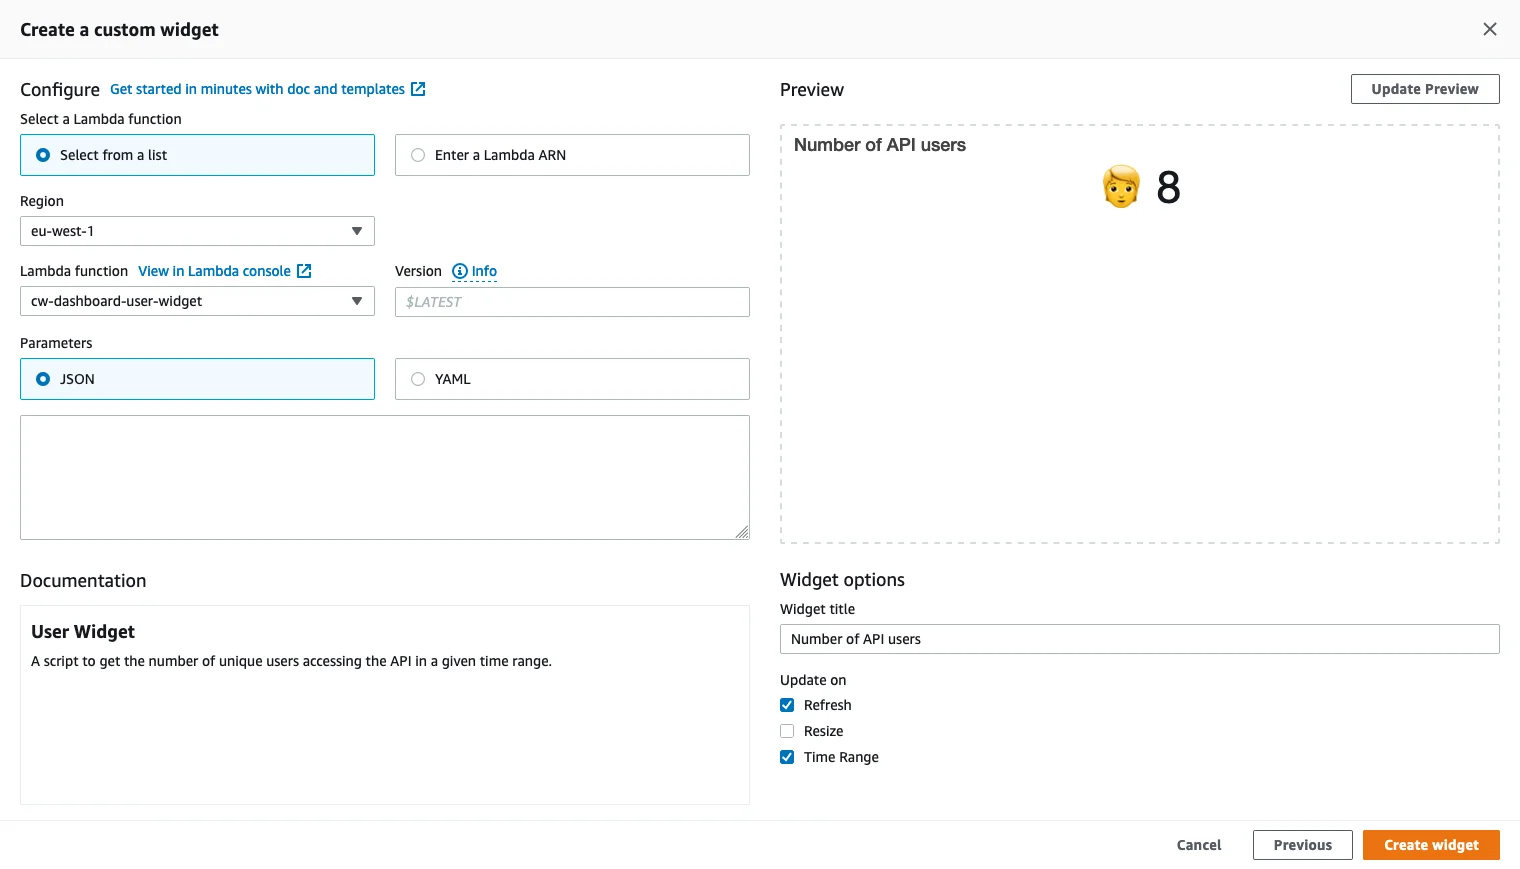
To get and show the exact number of users, we build a custom CloudWatch dashboard widget.
The widget will invoke a Lambda function, which will search through the CloudWatch logs with the insights query:
filter ispresent(user) and user != "-"
| stats count(*) as userCount by user
Once the query has been completed, we count the number of rows. The number of rows represents the number of users. For easier handling of the event data, I've decided to benefit from Powertools for AWS Lambda.
import os

import boto3
from aws_lambda_powertools import Logger
from aws_lambda_powertools.utilities.data_classes import (
    CloudWatchDashboardCustomWidgetEvent,
    event_source,
)
from aws_lambda_powertools.utilities.typing import LambdaContext

LOG_GROUP_NAME = os.environ["LOG_GROUP_NAME"]

logger = Logger()
cloud_watch_logs = boto3.client("logs")

DOCS = """
## User Widget
A script to get the number of unique users accessing the API in a given time range.
"""

CSS = """
<style>
.container {
    align-content: center;
    align-items: center;
    display: flex;
    flex-direction: row;
    justify-content: center;
    width: 100%;
}

.value {
    font-size: 45px;
}
</style>"""


def get_unique_api_users(start_time: int, end_time: int) -> int:
    start_query_response = cloud_watch_logs.start_query(
        logGroupName=LOG_GROUP_NAME,
        startTime=start_time,
        endTime=end_time,
        queryString='filter ispresent(user) and user != "-" | stats count(*) as userCount by user',
        limit=10000,
    )

    response = None
    while response == None or response["status"] != "Complete":
        response = cloud_watch_logs.get_query_results(
            queryId=start_query_response["queryId"]
        )

    return len(response["results"])


@logger.inject_lambda_context(log_event=False)
@event_source(data_class=CloudWatchDashboardCustomWidgetEvent)
def lambda_handler(event: CloudWatchDashboardCustomWidgetEvent, context: LambdaContext):
    if event.describe:
        return DOCS

    start_time = event.widget_context.time_range.start
    end_time = event.widget_context.time_range.end
    if event.widget_context.time_range.zoom_start:
        start_time = event.widget_context.time_range.zoom_start
        end_time = event.widget_context.time_range.zoom_end

    return f"""
{CSS}
<div class="container">
    <div class="value">
        🧑 {get_unique_api_users(start_time=start_time, end_time=end_time)}
    </div>
</div>"""
An event with only the describe attribute will return the widget's documentation. When the Lambda function gets invoked through CloudWatch the Lambda function returns the widget's HTML code, with custom styling. The widget does not support any custom input parameters. To not invoke the Lambda function too often, it should only be updated when the dashboard gets refreshed or the selected time range changes.
While the widget will always show the exact number of API users and not just an approximation, there are some drawbacks as well:
- querying will become slower the wider the selected time range is
- querying will become slower with an increasing number of users
- the query may time out and show no result at all
- the Lambda function may time out
- each refresh of the widget results in a Lambda function invocation
Conclusion
We looked at two options to view the number of API users in a CloudWatch dashboard. By using a custom widget, we ensure to always get the exact number of API users in a given period. Finally, we looked into the drawbacks of our solution.
What do you think about this approach? How did you solve it in your projects in the past? I'm very keen to learn from you, so please don't hesitate to reach out to me.


We use cookies on our website. Some of them are essential,while others help us to improve our online offer.
You can find more information in our Privacy policy