
.From zero to concept - PoC of Datadog at BARMER

Every Proof of Concept (PoC) aims to determine and test a product or solution for its feasibility and viability. The result should grant insights if the potential solution to the problem is creating business value through means such as increased productivity, cutting costs or creating new potential revenue.
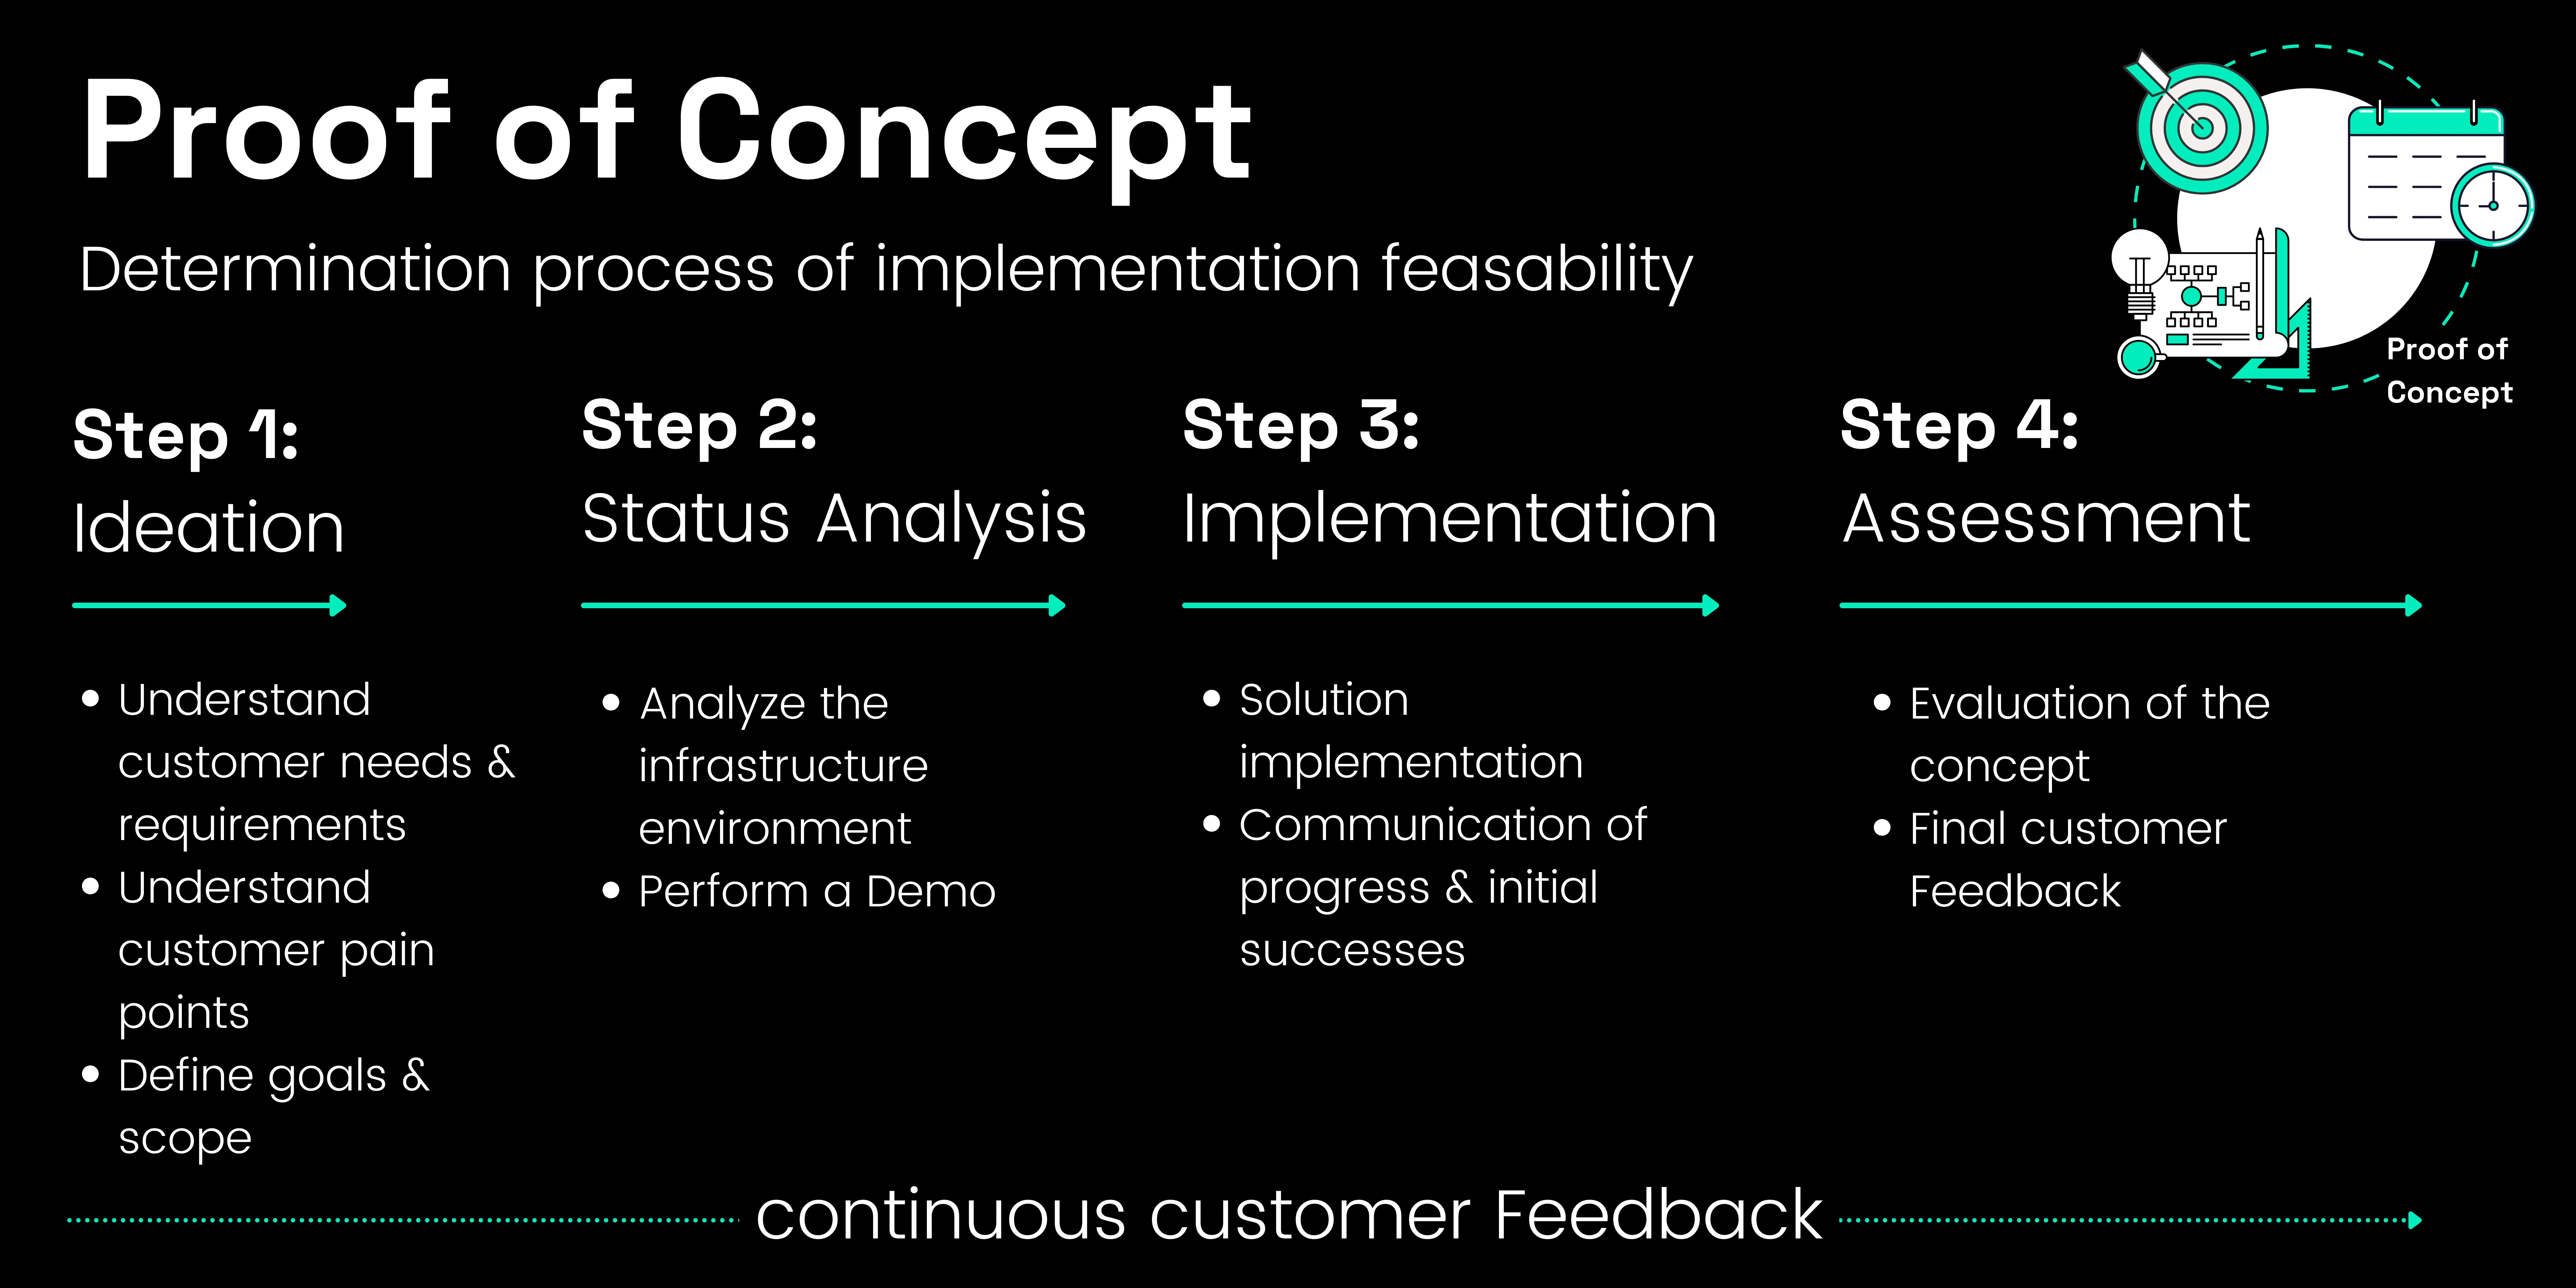
Step 1 - Ideation
The most important step in the beginning is to understand the needs and requirements of your customer and the pain points that the customer is trying to solve. Therefore the first step, even before the actual PoC starts, is to define the goals and the scope to ensure to keep the scope narrow and focus on customer requirements. In this case the challenge for our customer BARMER was to “Centralize all of their applications and infrastructure logs in one platform!”.
This is where Datadog comes in place. Datadog is one of our preferred solutions when it comes to logging and monitoring. Through our expert knowledge and our experience with the solution in various business use cases, our team has the ability to provide guidance and expertise to execute the PoC in an efficient and timely manner.
Step 2 - Status analysis
Our Proof of concept is starting with the phase of status analysis. In this step the following questions are tackled in workshops together with the customer:
- What is the current underlying infrastructure?
- Which Applications are in place?
- Is the customer already familiar with the product we offer?
Additionally, as a customer of course you would like to know, what is the platform possible to perform and are there any functions which we are not aware of yet, but could be beneficial for our environment. Therefore a detailed Demo is also part of the Kickoff.
Step 3 - AWS Infrastructure Monitoring
After the foundation for a successful PoC has been laid, the next step is to start the technical implementation.
- AWS Account onboarding:
Initially there is the need to deploy an IAM Role to grant authorization for Datadog to retrieve information from the account. - First platform overview:
With such minimal steps like the onboarding of the accounts we already gained insights via Metrics, Host Map and Dashboards into the different services in place.
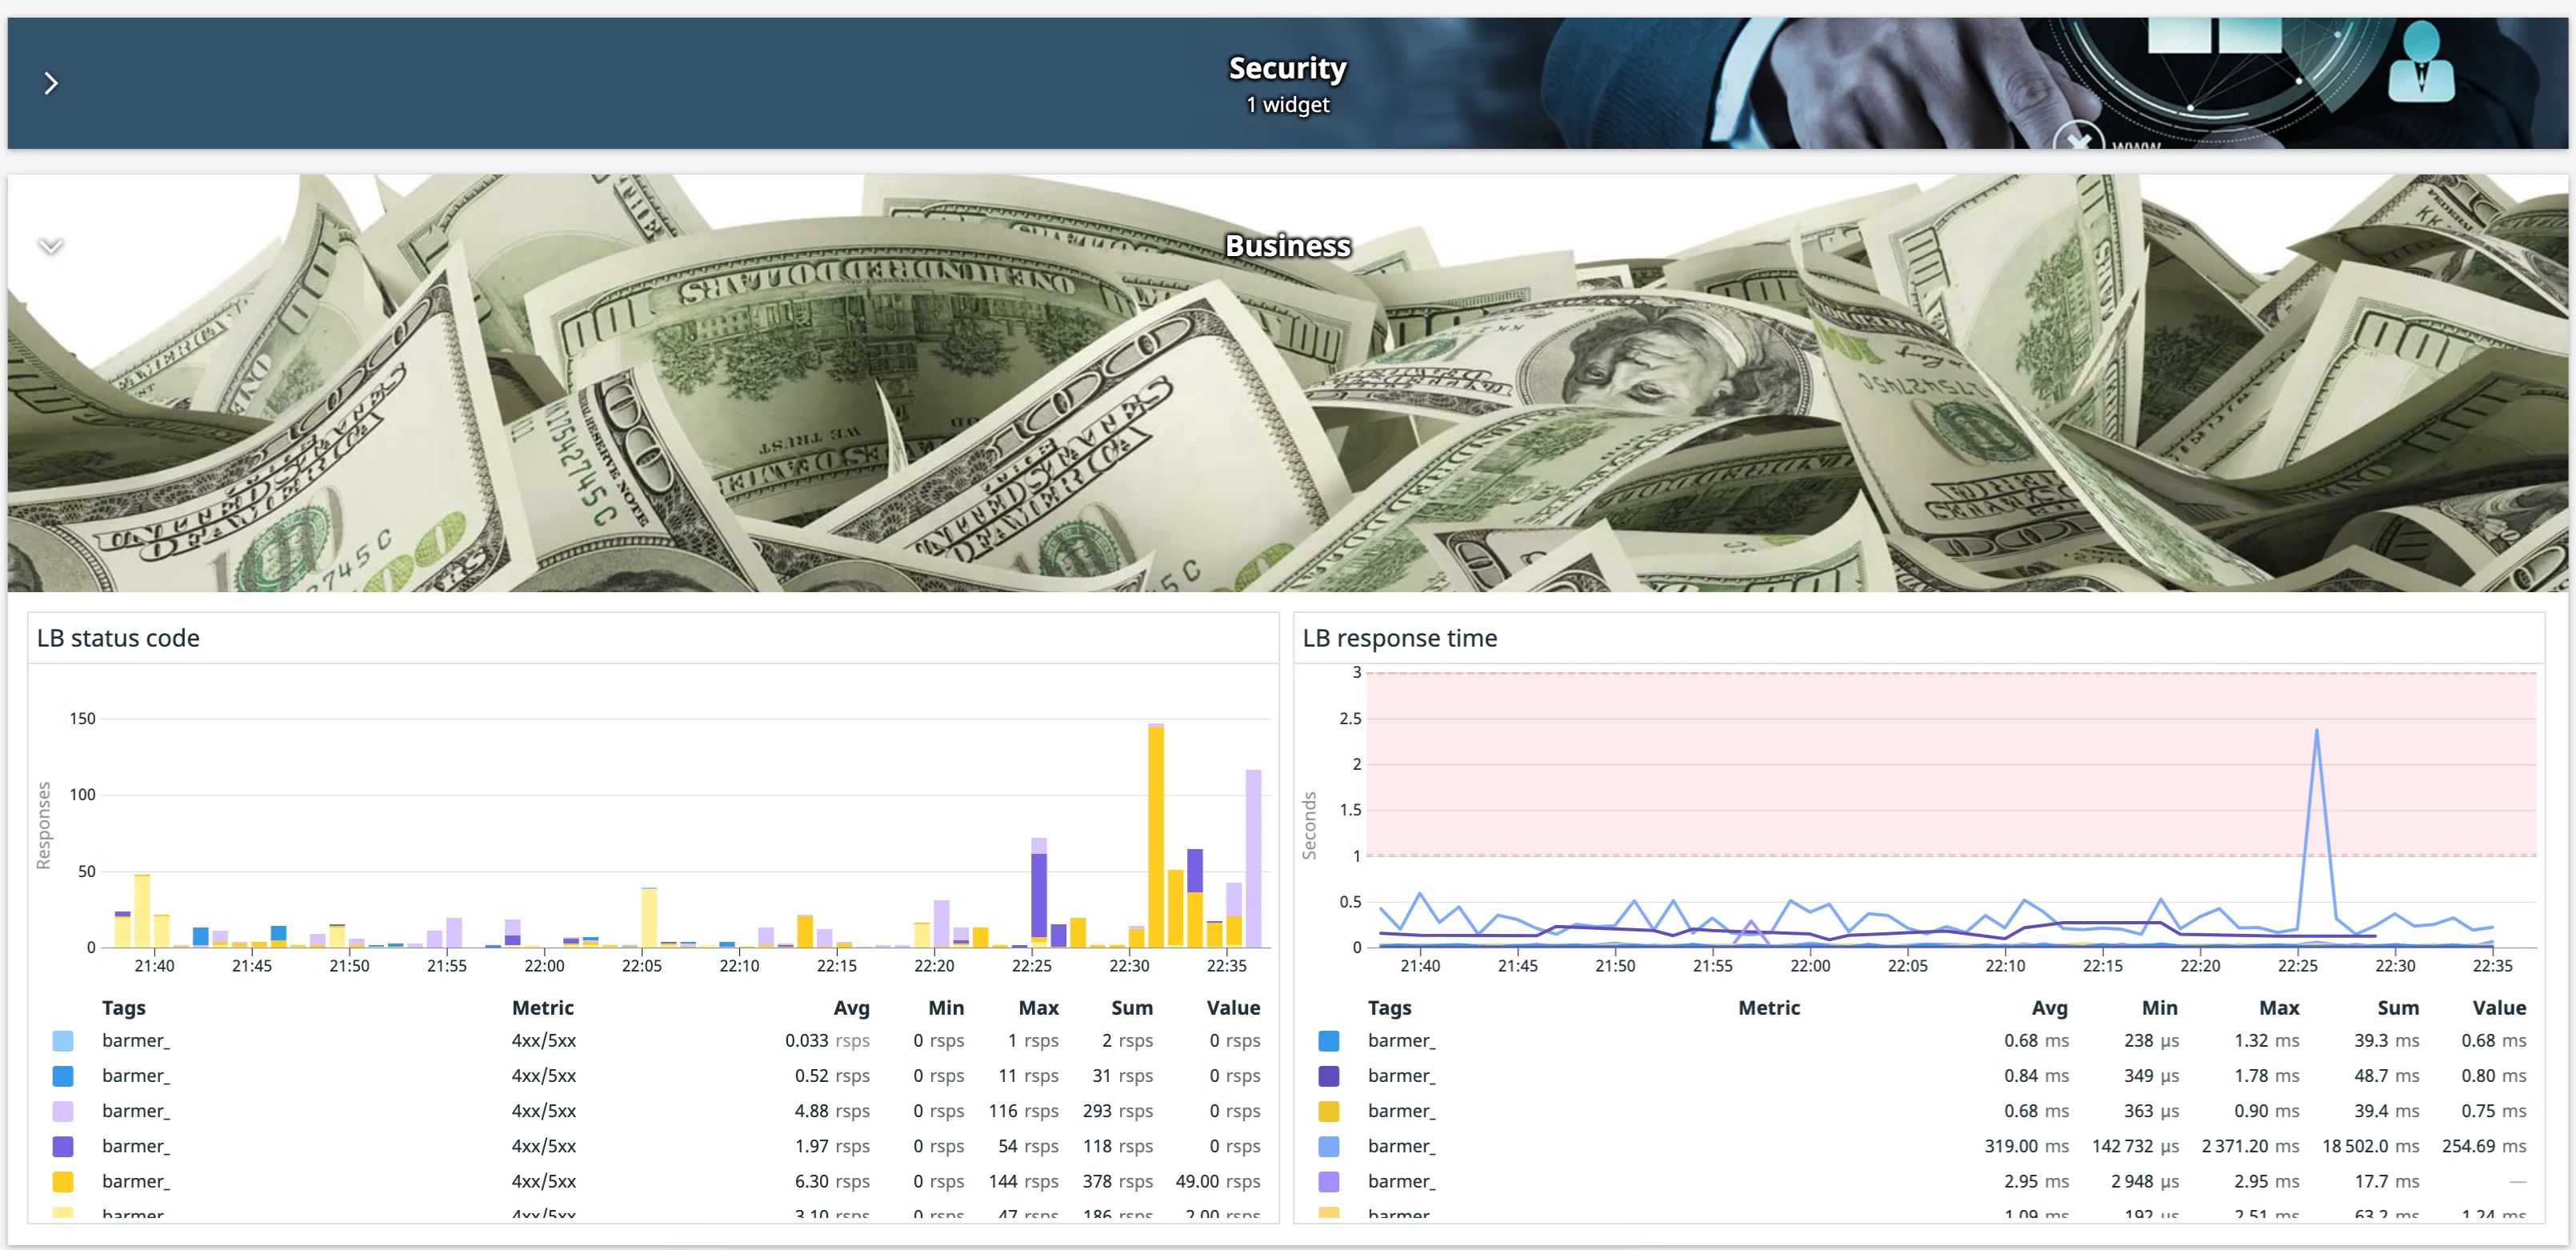
Step 4 - AWS Infrastructure Logging
In this step we are connecting the different log sources to Datadog. The linking leads to the fact that we get a centralised overview of all logs. Specifically talking about:
- Load Balancer Access Logs
- Firewall logs (WAF Logs)
- Network Access Logs (VPC Flow Logs)
- AWS Access Logs (CloudTrail)
- API Gateway
Step 5 - Application Logs & Metrics
Now that you have the infrastructure onboarded, you want to dive deeper and take a closer look at the different applications. To do this, you send the various App metrics & logs to Datadog to get a holistic overview of your system. This includes the classic areas of serverless, container and server:
- Connect container cluster with Datadog (Amazon EKS)
- Connect functions as a Service with Datadog (AWS Lambda)
- Connect classic server with Datadog (AWS EC2)
With all this information put into Datadog we are finally able to build our first customised dashboard. The Dashboard fulfils the customer specific requirements, and gives an understanding of how Datadog can replace the existing systems, in this case Grafana.
Step 6 - Process integration and Identity & Access strategy
The tools that are normally used must also be connected to Datadog. Additionally third-party systems like internal communication tools, must be integrated into the business workflow.
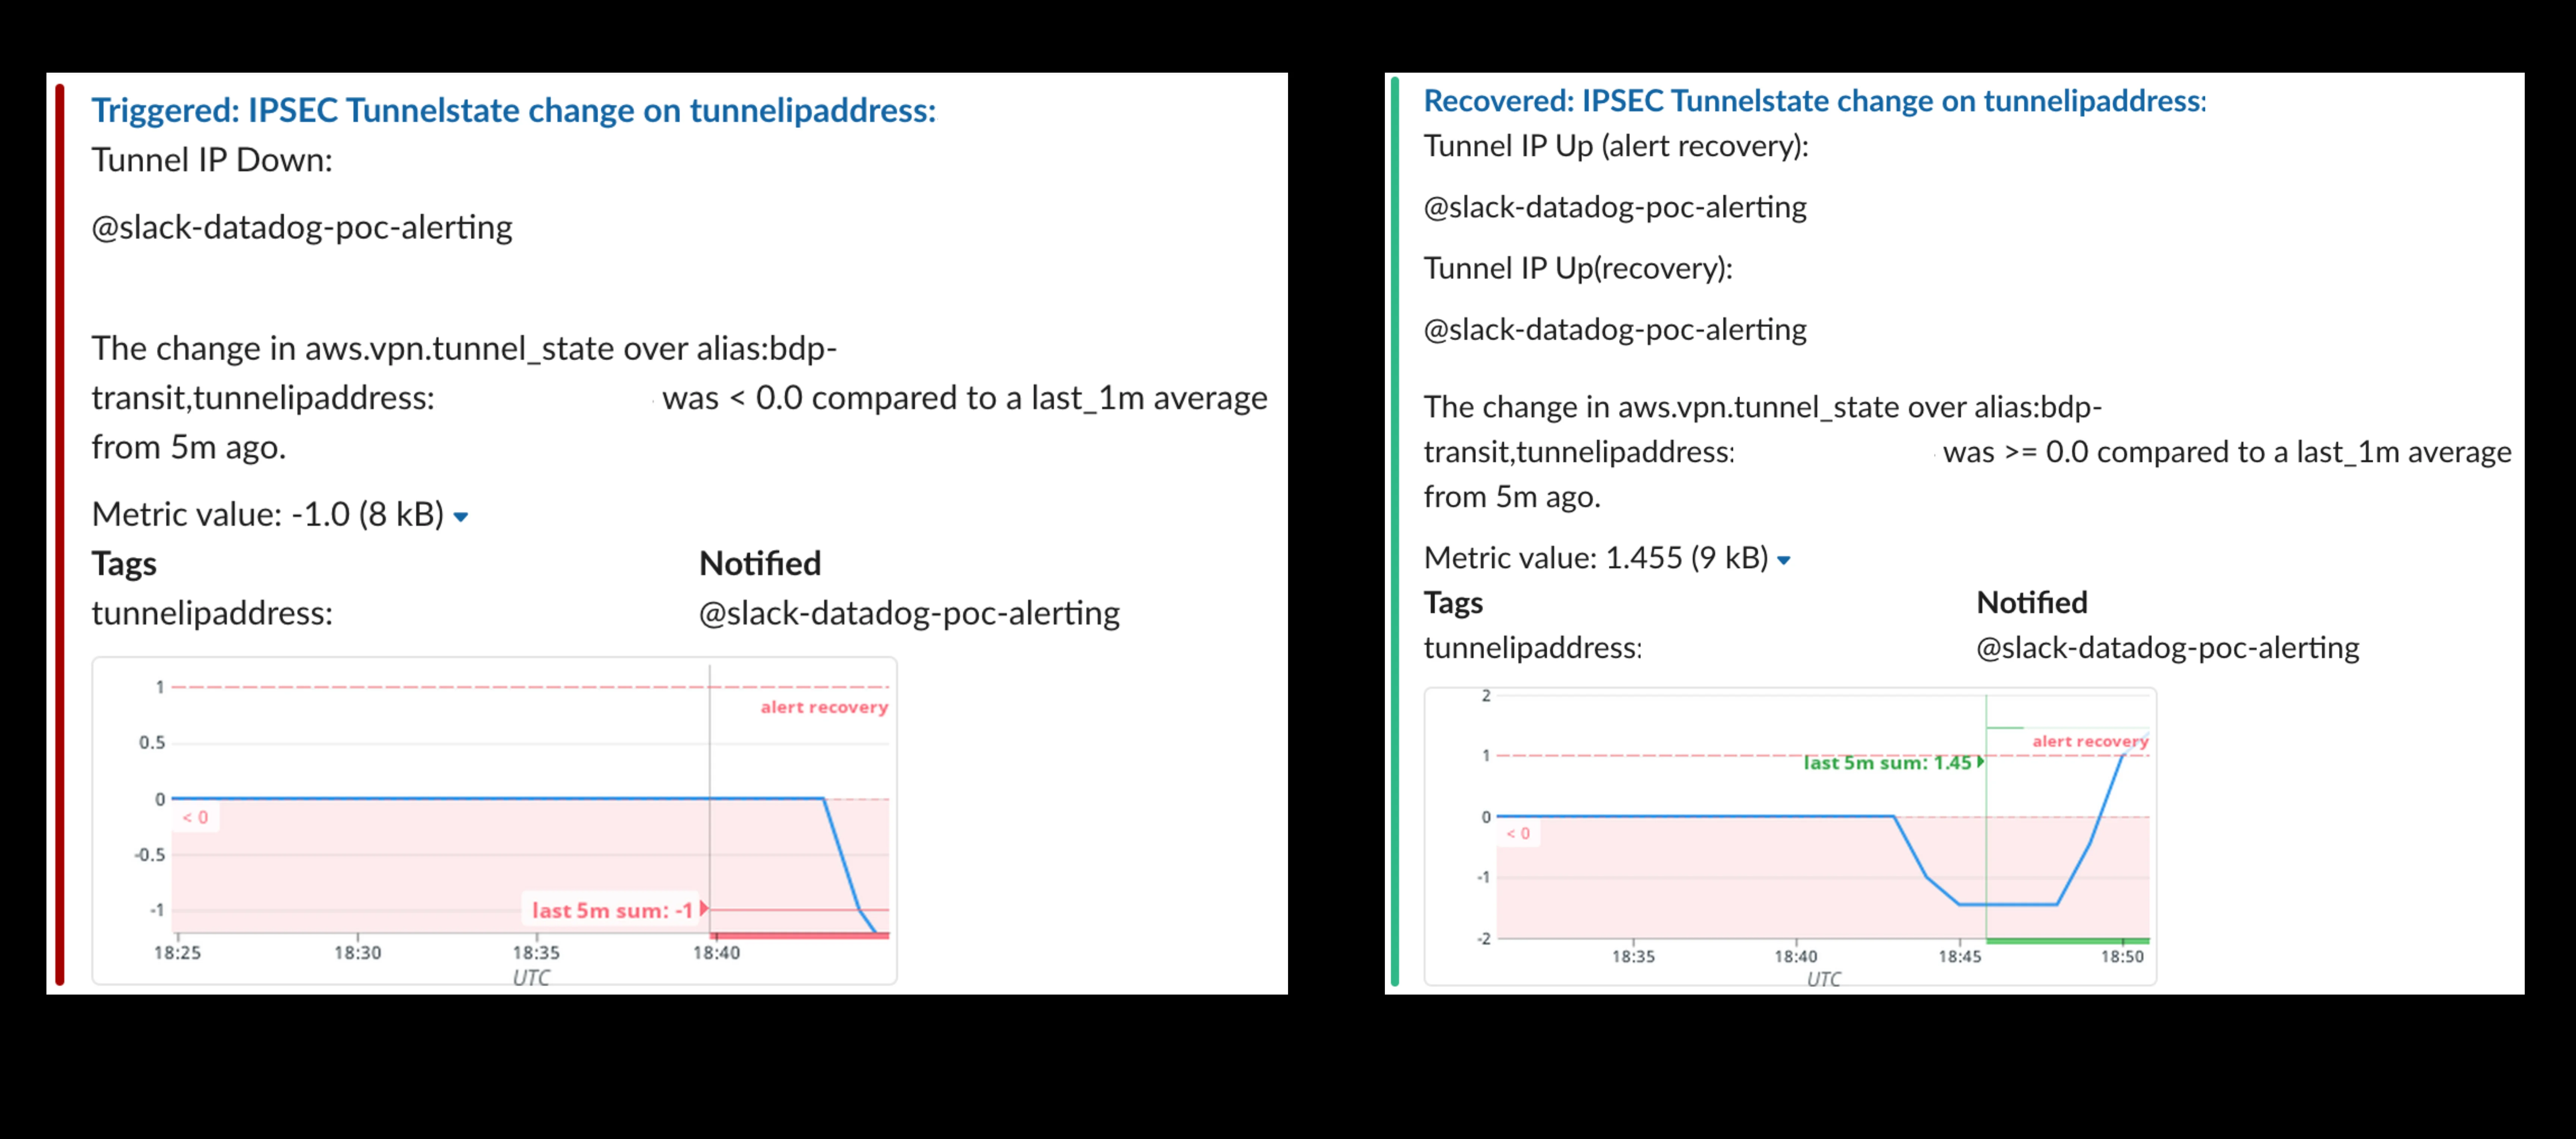
- Slack integration:
In that case you get immediate notifications in your communication channel about potential issues and the current state of the system. As you can see in the picture, you will get immediate information in case your system has any downtime, so you can tackle the issue directly. Additionally you will also receive status updates about the recovery of the system, so you get a continuous overview of the availability and status.
- Role-based access control (RBAC) setup to restrict access to sensible logs:
If more control over the access to the platform is needed, there is the possibility to define customised access roles.
Step 7 - Application Performance Monitoring
To give the customer the possibility to identify application-specific bottlenecks, we integrated the APM monitoring for serverless and container environments.
It was even possible to integrate new features which had just been launched a few weeks before the POC started. So we implemented the database monitoring which led to seeing all the query statements and their execution plans.
- Function as a Service applications (AWS Lambda)
- Container (Amazon EKS)
- Database Performance Monitoring
Step 8 - Assessment
After 10 days we successfully onboarded all kinds of different workloads and got great visibility of the different parts of the system which gave our customer BARMER a really good impression about the capabilities of the Datadog platform knowing to have a strong partner on their side to tackle future requirements.
Proving a concept is an extremely valuable tool that can save you time, money and headaches in the long-term through better planning in the short-term. The goal is not to build a version of the product that resembles the finished product but rather to test and validate assumptions related to process, technology and to demonstrate that the core functionality is achievable.
To ensure those factors, the most crucial aspect is to have the right team to make it a successful endeavor. An IT specialist should have the capacity to enable customers to imagine the final outcome while still in the arranging stage. It's important to be flexible and think about any changes or potentially increases, including adjustments that could make its utilisation more compelling or simply simpler.


We use cookies on our website. Some of them are essential,while others help us to improve our online offer.
You can find more information in our Privacy policy